Values from a source dataset
Examples: SRTM-derived elevation pixels, Landsat imagery and Phil-LiDAR flood-hazard classes. Resolution, date and limits still apply.
LANTAW · A living atlas of the Philippines
(Have you climbed Mount Pulag?)
Maybe not. But what if you could still understand its ridges, clouds and stories by moving through the mountain yourself?
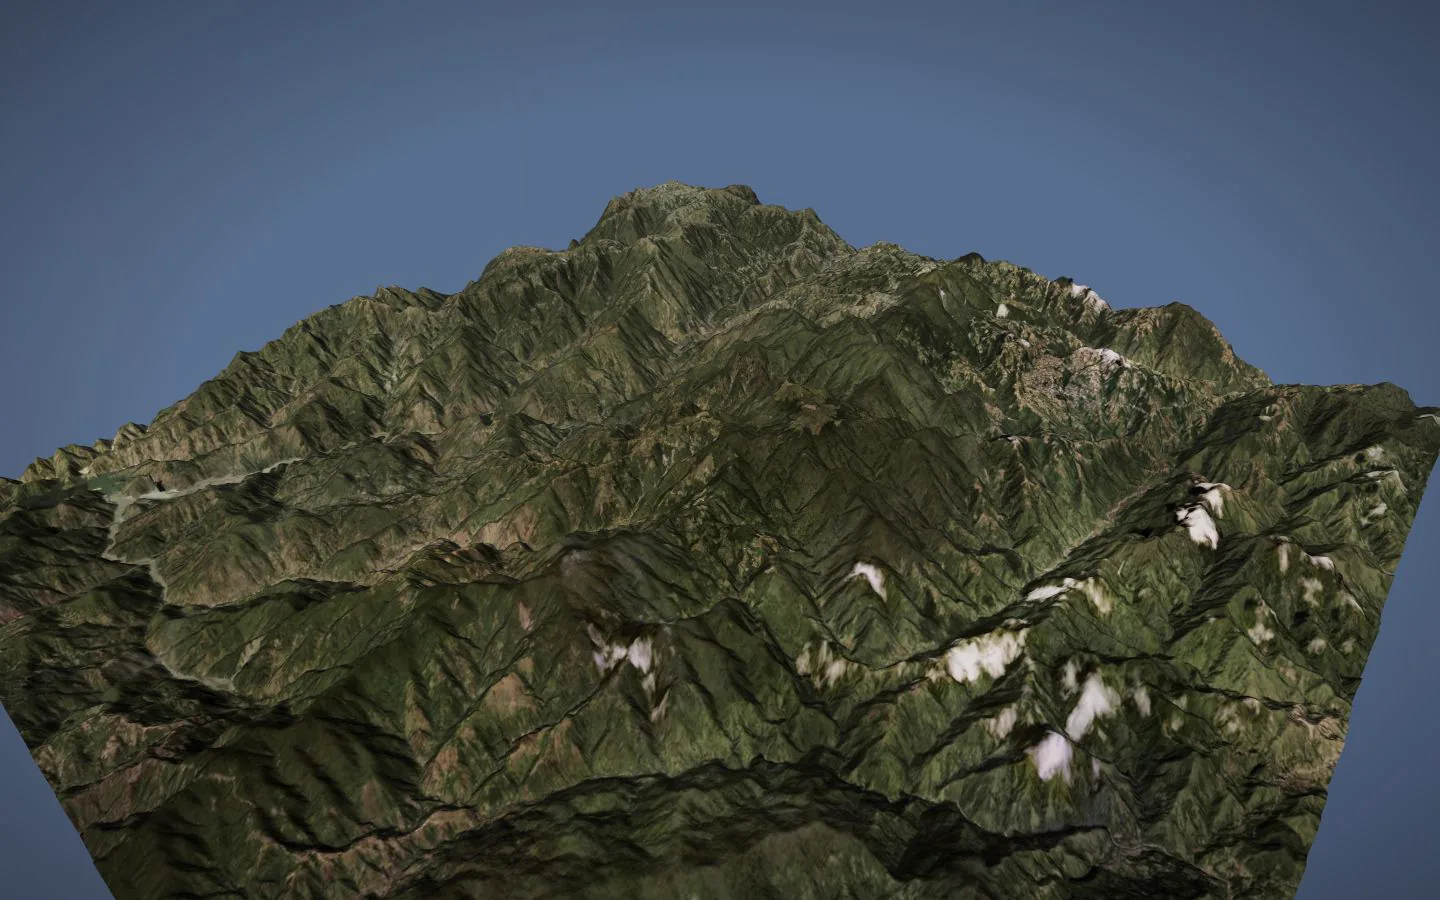
Project overview · 02
LANTAW is a browser-native atlas of Philippine terrain, water, memory and risk. Every scene combines measurable ground, cited imagery and authored context—then shows where its certainty ends.
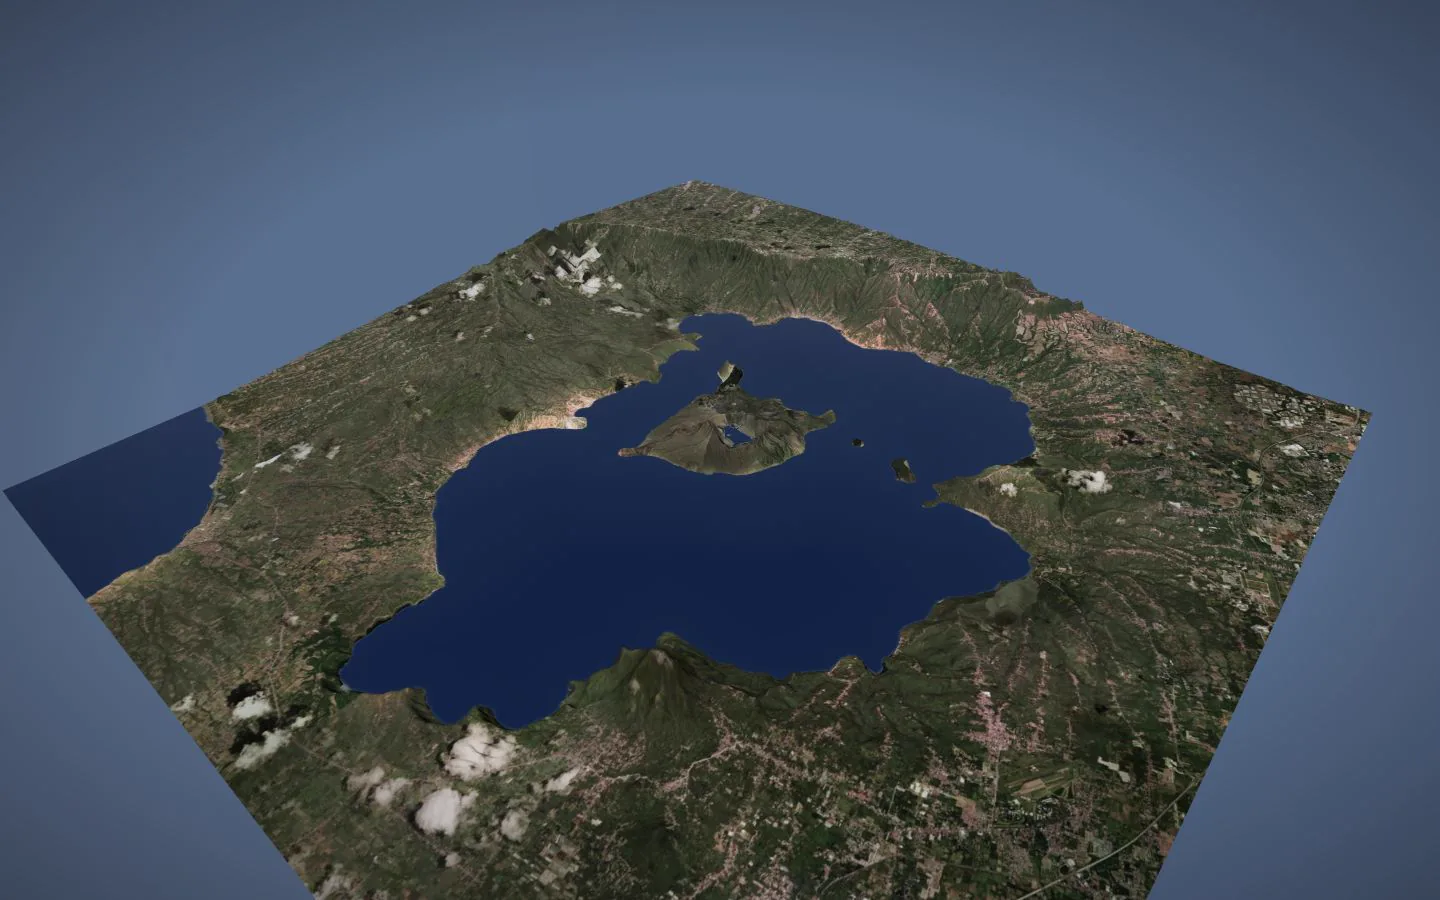 Volcano · BatangasTAALElevation + authored event
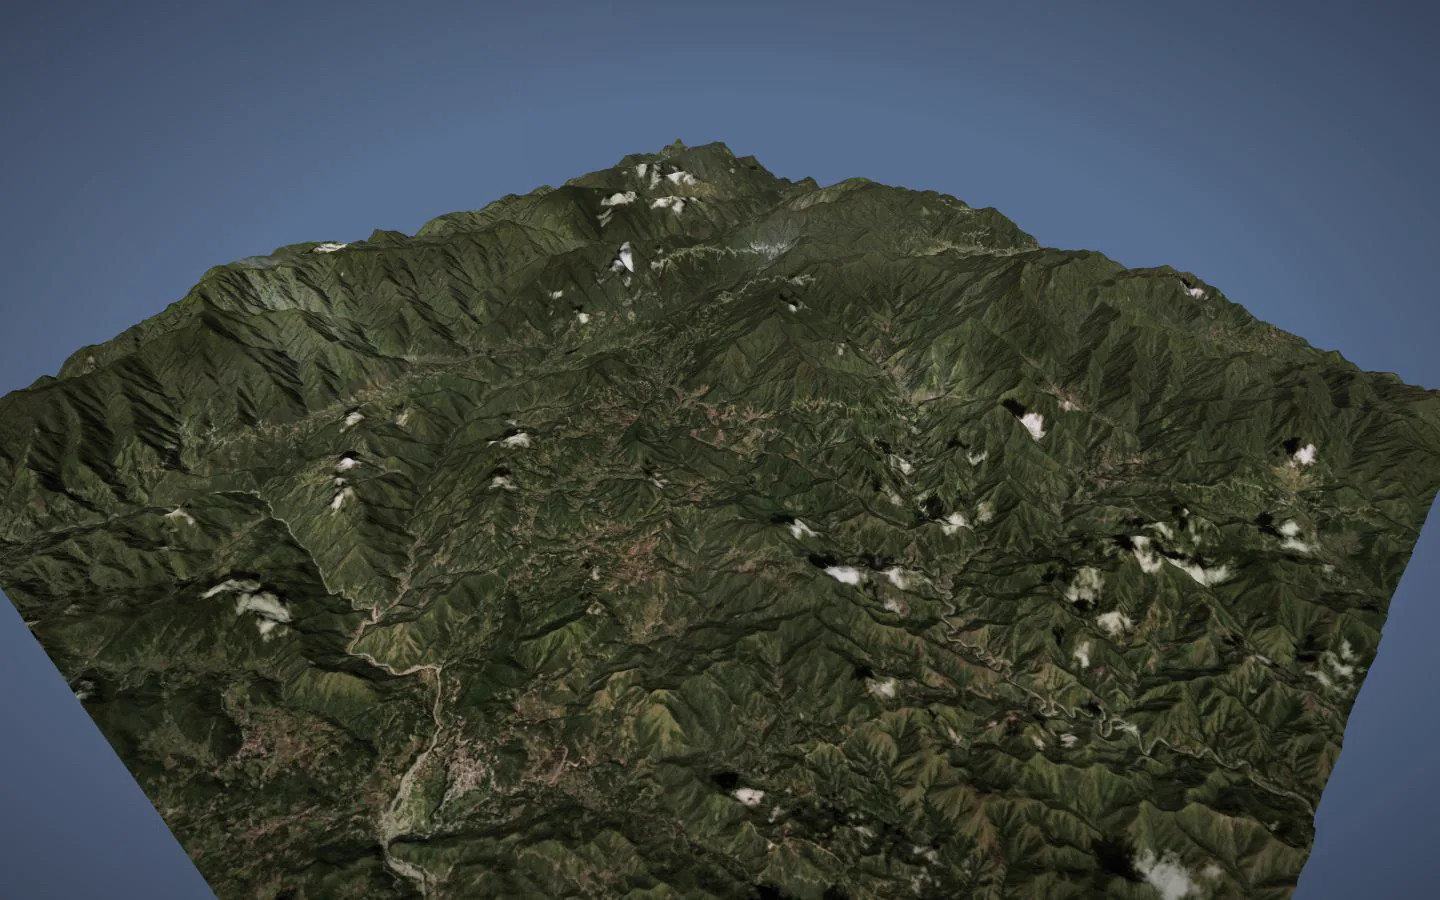 Heritage · IfugaoBANAUETerrain + cultural context
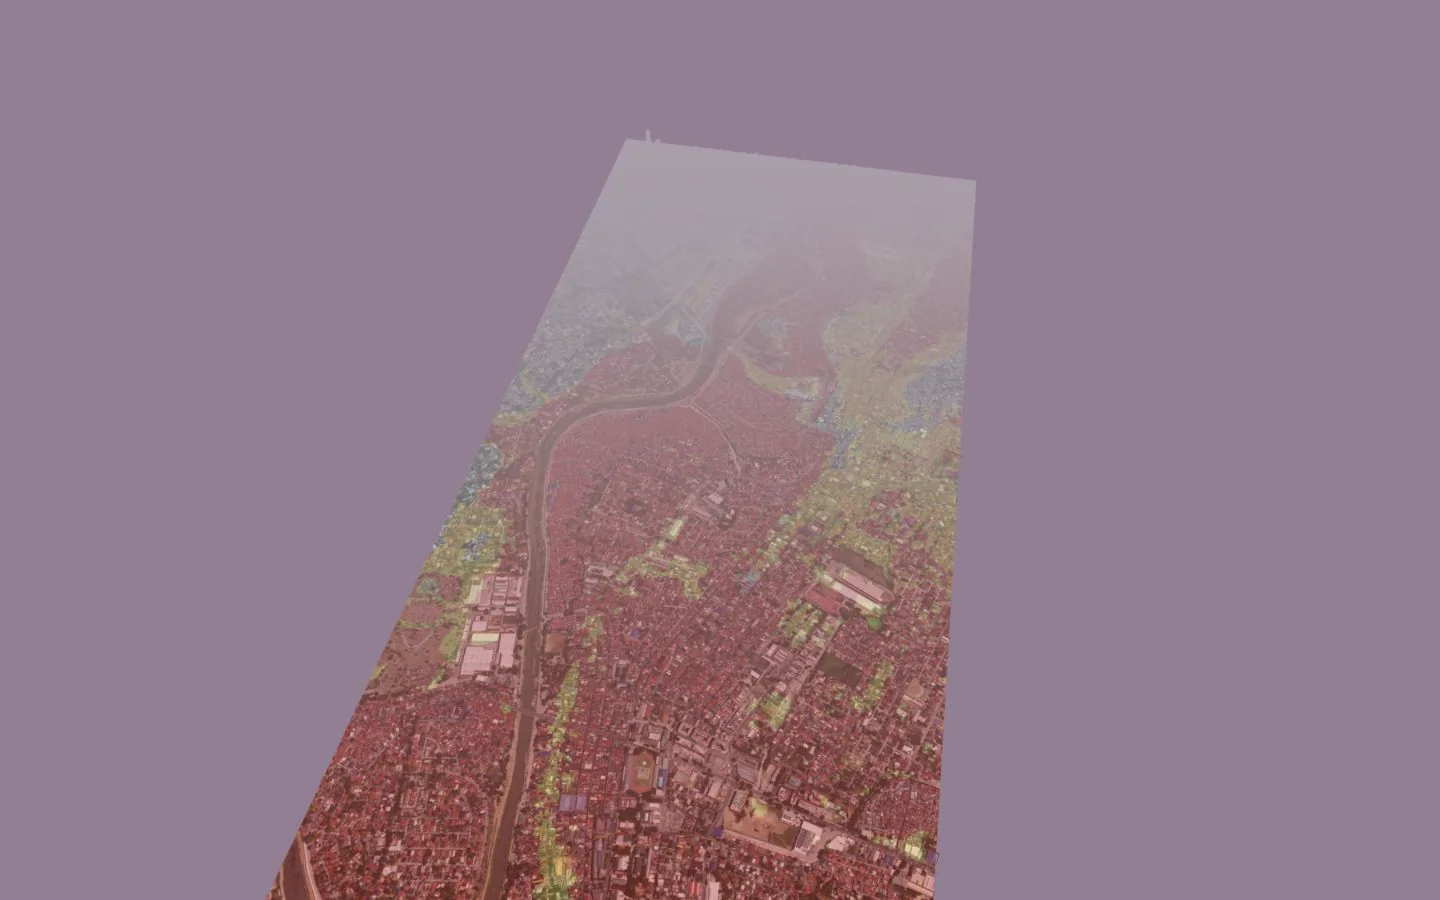 Flood · Metro ManilaMARIKINAHazard + urban form
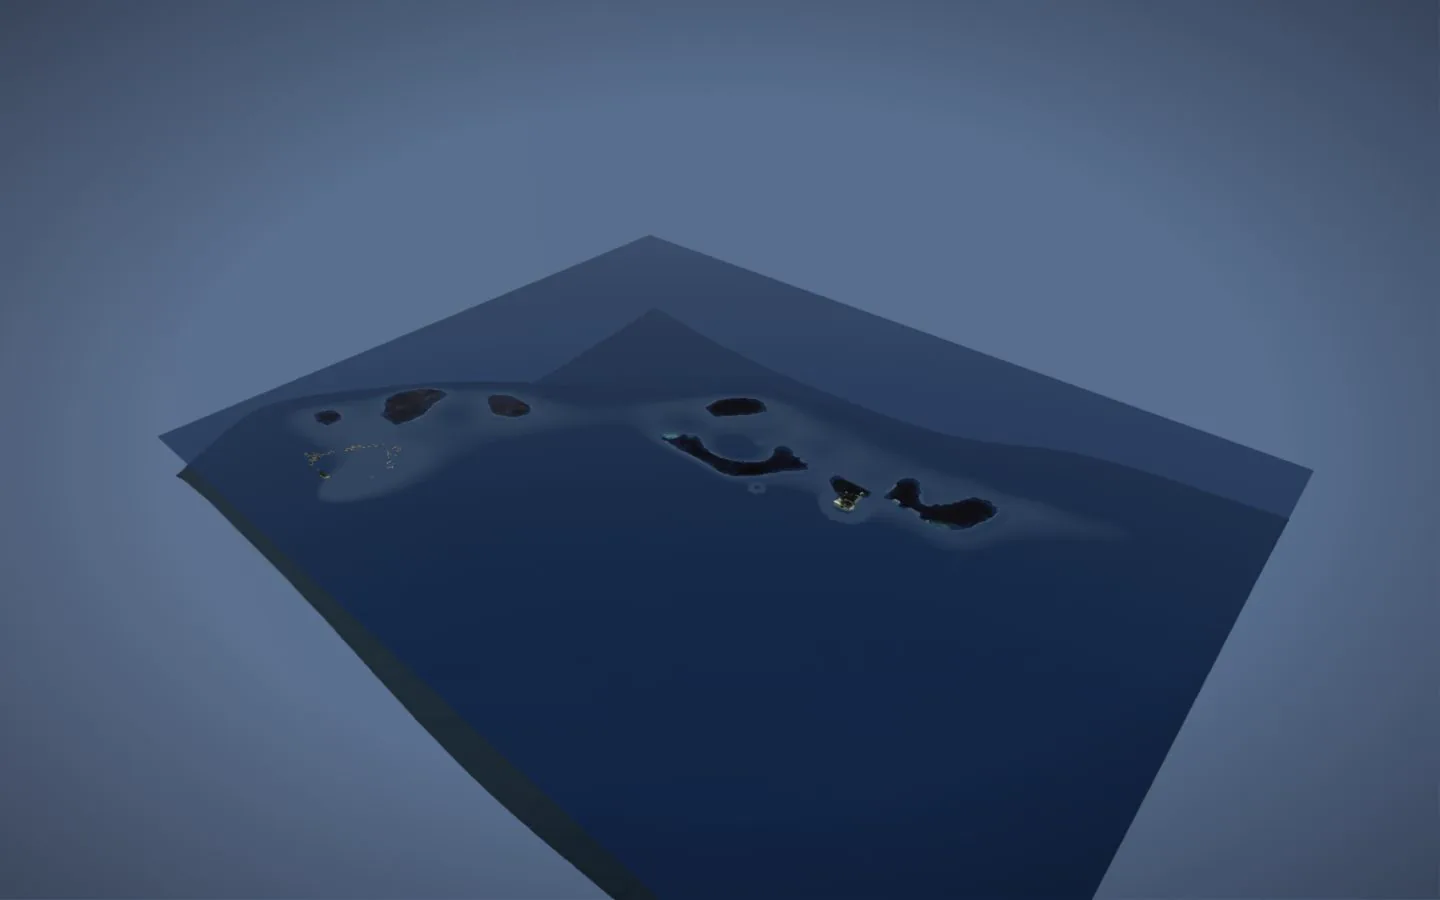 Island · West Philippine SeaPAG-ASATerrain + Sentinel-2
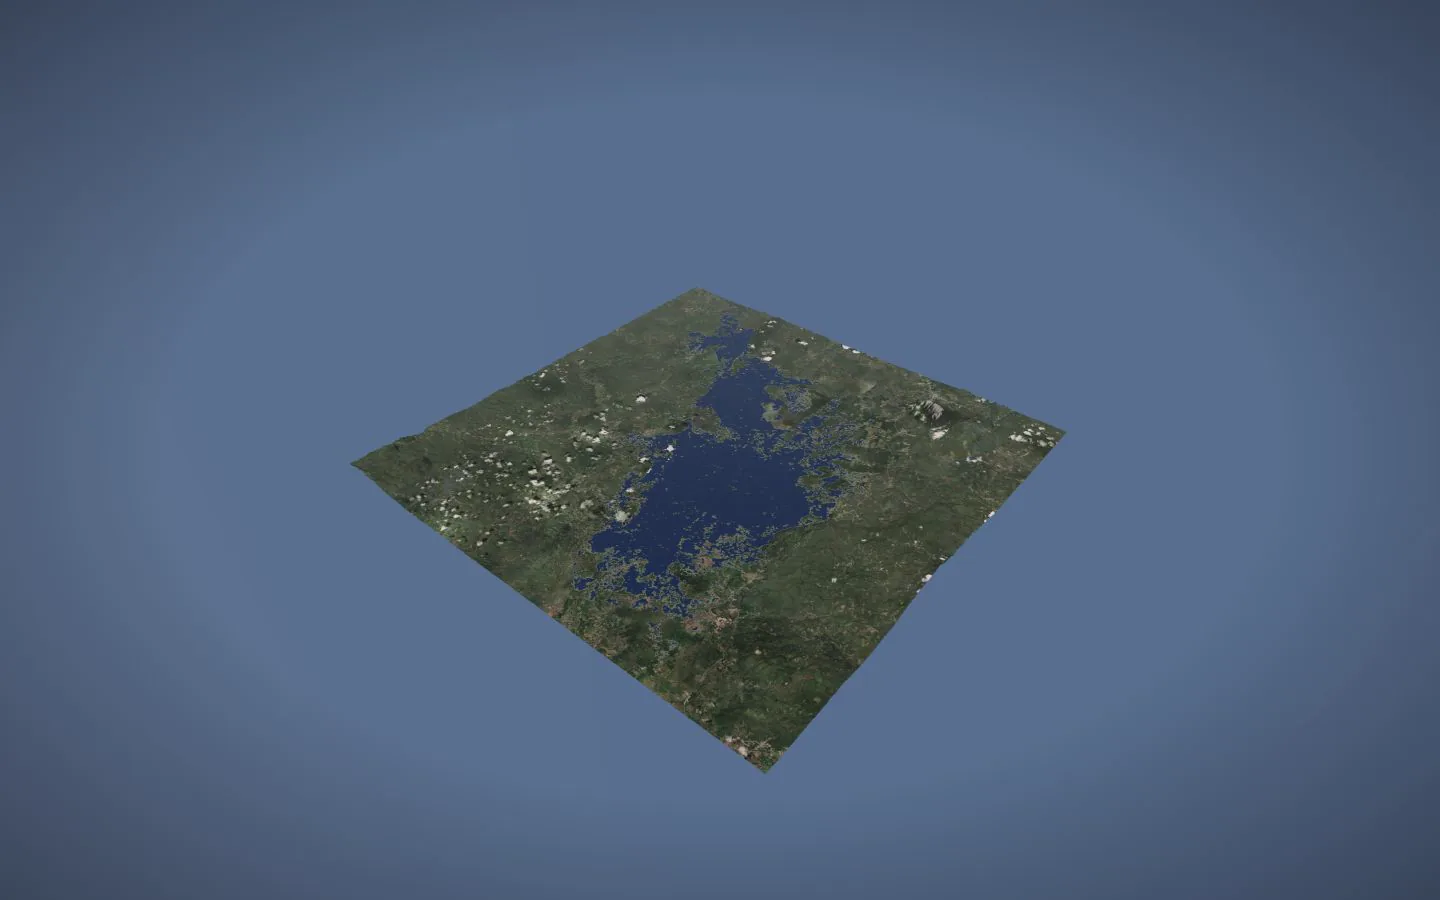 Wetland · MindanaoAGUSANWater + climate context
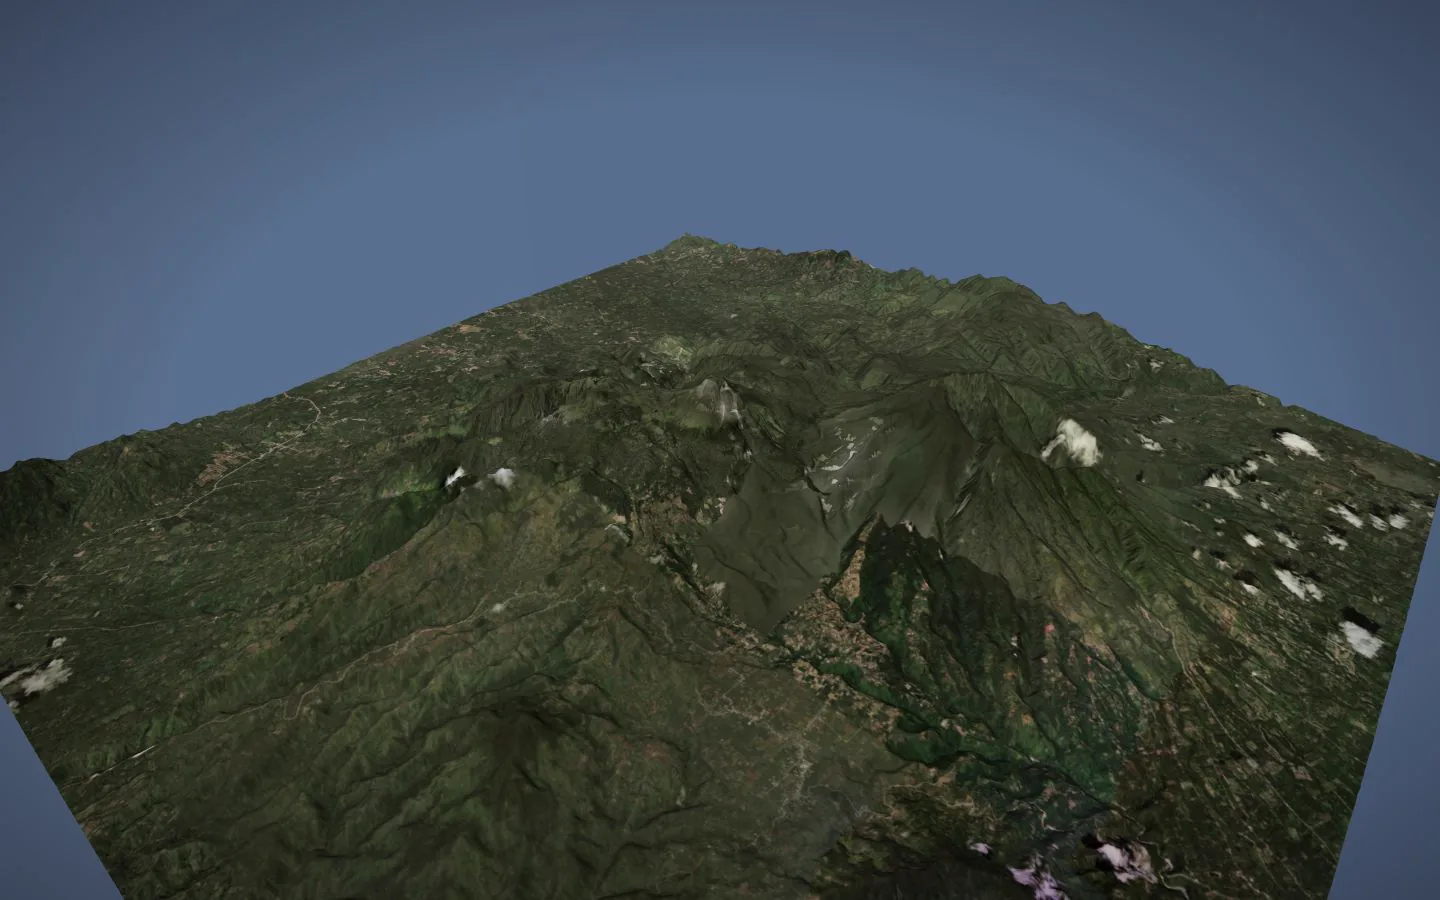
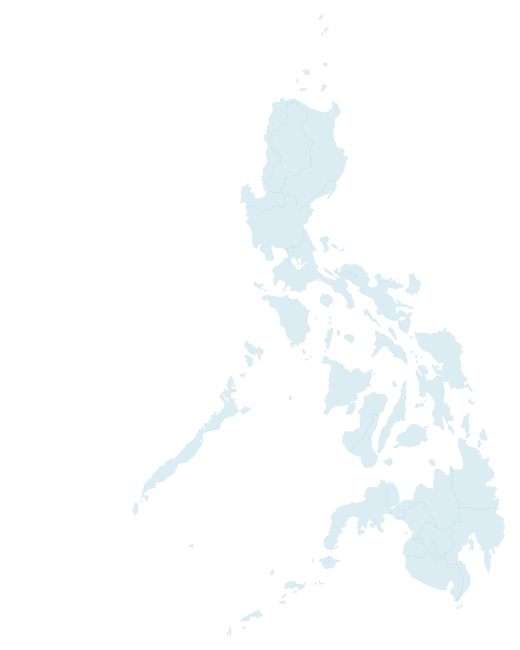 16.59° N · Pulag
 6.99° N · Apo14.01° N · Taal
The problem · 03
Stories, coordinates, elevation and risk usually live in separate places. LANTAW brings them into one explorable view, so the land is easier to understand before you ever arrive.
The build · 04
LANTAW turns elevation pixels into a mesh, drapes cited imagery over it, then adds the labels and disclosures that explain what you are actually seeing.
Built for classrooms · climate literacy · cultural memory · curious Filipinos
The live proof · 06
Every point opens an authored 3D scene. Hover a marker to preview it, click to step inside.
Full collection
28 places
Data trust, in plain language
Every LANTAW scene combines several kinds of evidence. These labels tell you how much weight to place on each one.
Read the complete methodologyExamples: SRTM-derived elevation pixels, Landsat imagery and Phil-LiDAR flood-hazard classes. Resolution, date and limits still apply.
Examples: the 3D mesh, hill shading, building-to-hazard joins and image tone balancing.
Examples: unsurveyed bathymetry, sub-resolution islets, cloud decks and stylised eruption replays.
Labels, story routes and scene narration are researched editorial layers, linked back to their sources.